What they needed
The CEO was producing weekly and termly reports on the trust’s pupils from a template. Every time, he or someone else had to go and find the figures.
What I did
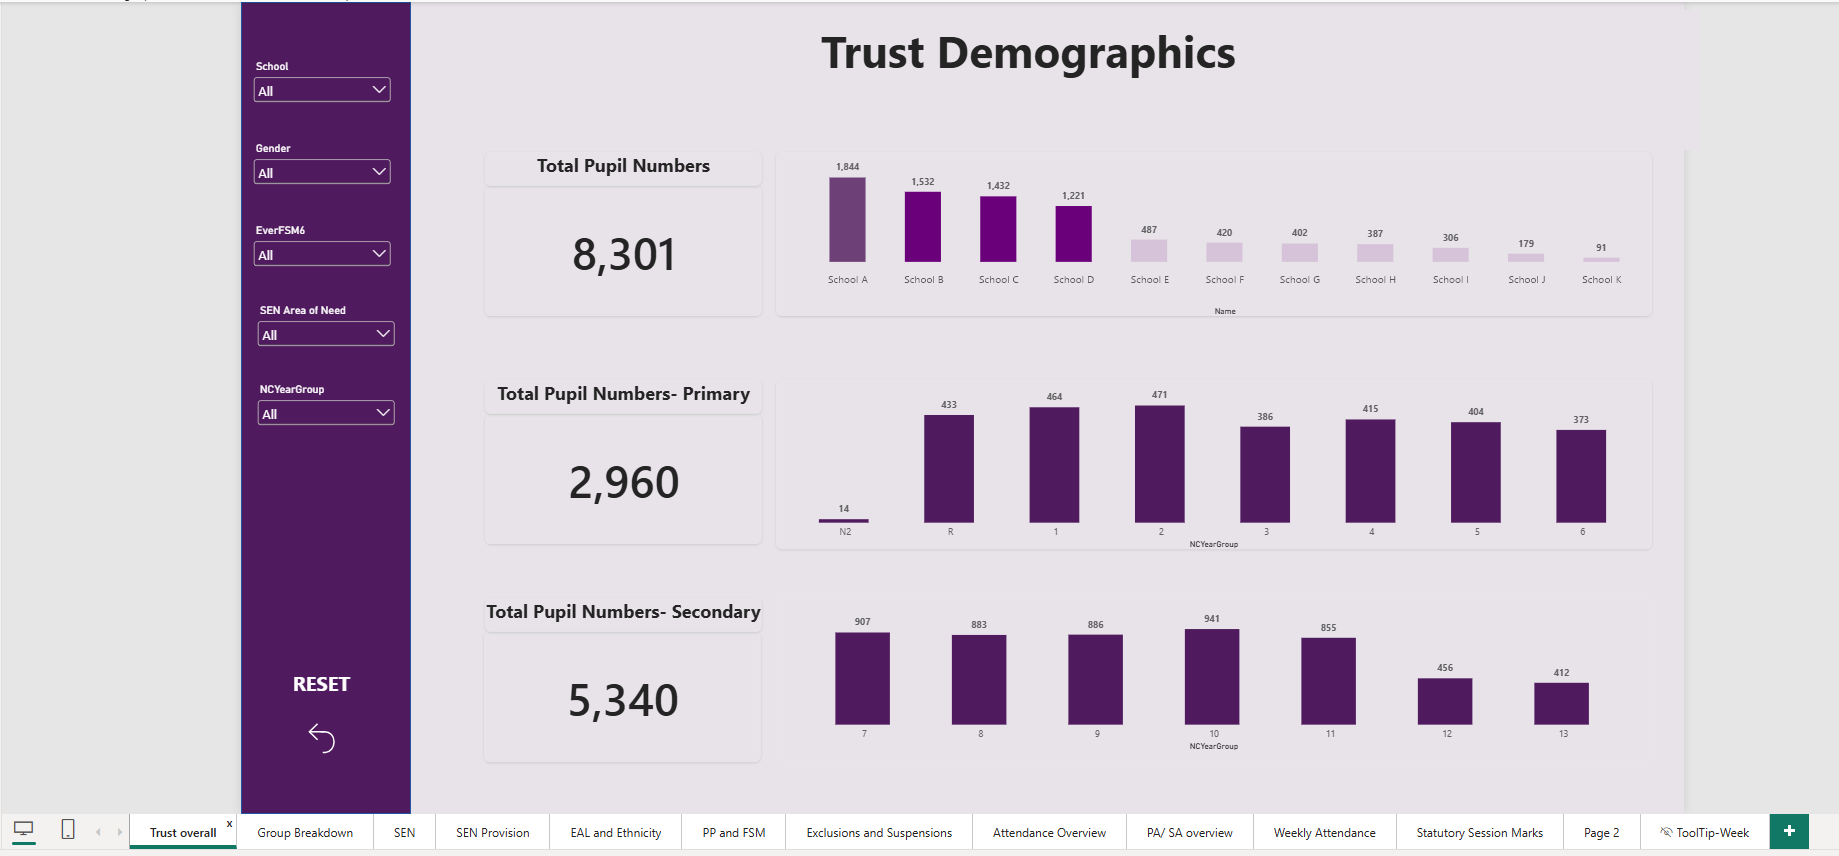
I built a Power BI trust dashboard showing pupil numbers by school, phase and year group. Leaders can filter by school, gender, free school meals, SEN area of need and year group. Further pages cover SEN, EAL and ethnicity, pupil premium and FSM, exclusions and suspensions, and attendance.
The result
The trust now uses the dashboard in board meetings and with trustees. The CEO no longer builds those reports by hand, and the time spent searching for data has been given back to him.